


Scotland mortality 2022 week 27
Summary of Scotland’s mortality and excess mortality through Week 27 of 2022. All data mortality and population data via National Records of Scotland

Overall
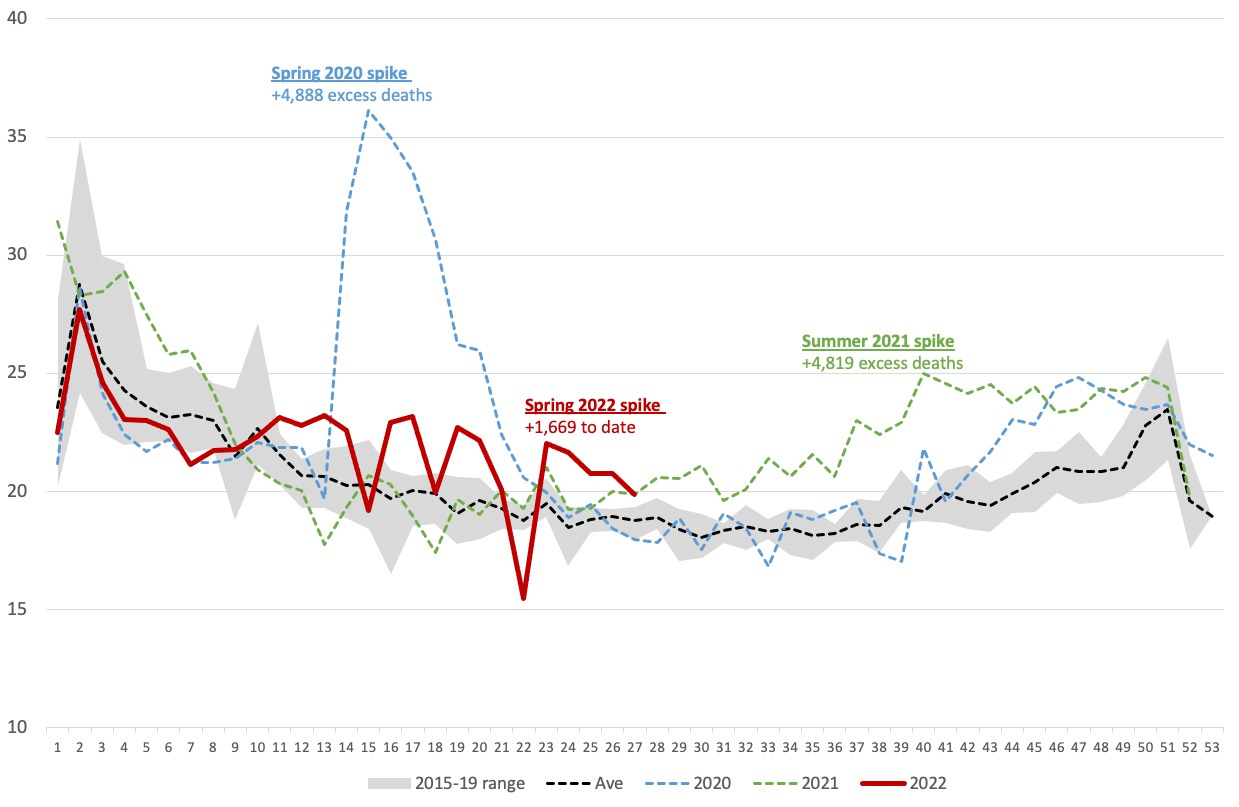
2021 saw excess mortality suddenly rise in Scotland despite it being summer. This happened 12 weeks post Dose 2, and thereafter we had 32 weeks of excess. Now in 2022 we see the same rising trend, coincidentally starting 12 weeks post ‘Booster’.
Week 26 revised up to +11% (110 more deaths than normal).
Week 27 initially +7% (71 more deaths than normal).
Spring 2022 cumulative excess
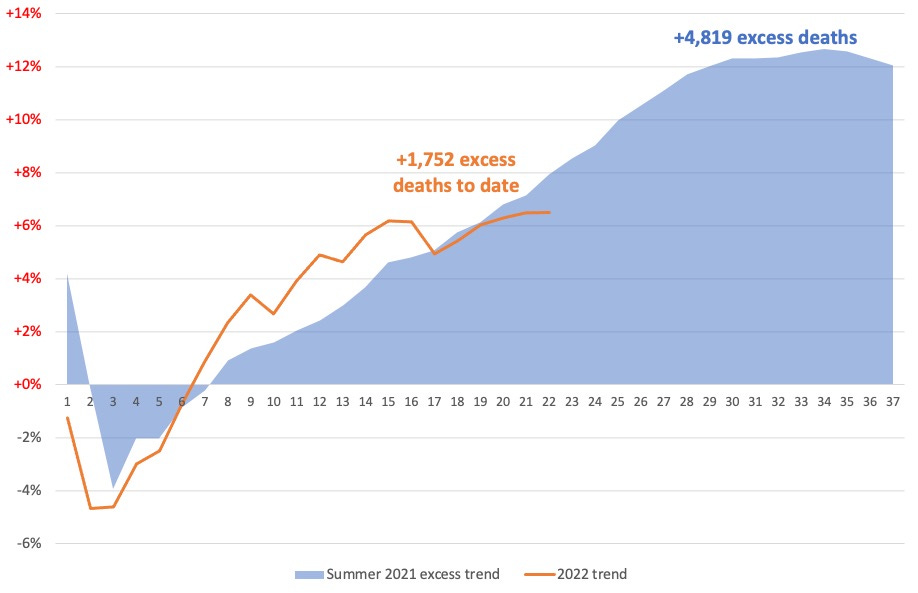
In 2021 Scotland had excess mortality for a record 32 weeks – in total 12% above average over that period, 4,819 added deaths. In 2022 we have +1,752 deaths more than would be expected. The trend had been higher than 2021, but is now looking like easing. Still excess, but now a little slower than last year.
Excess mortality by cause
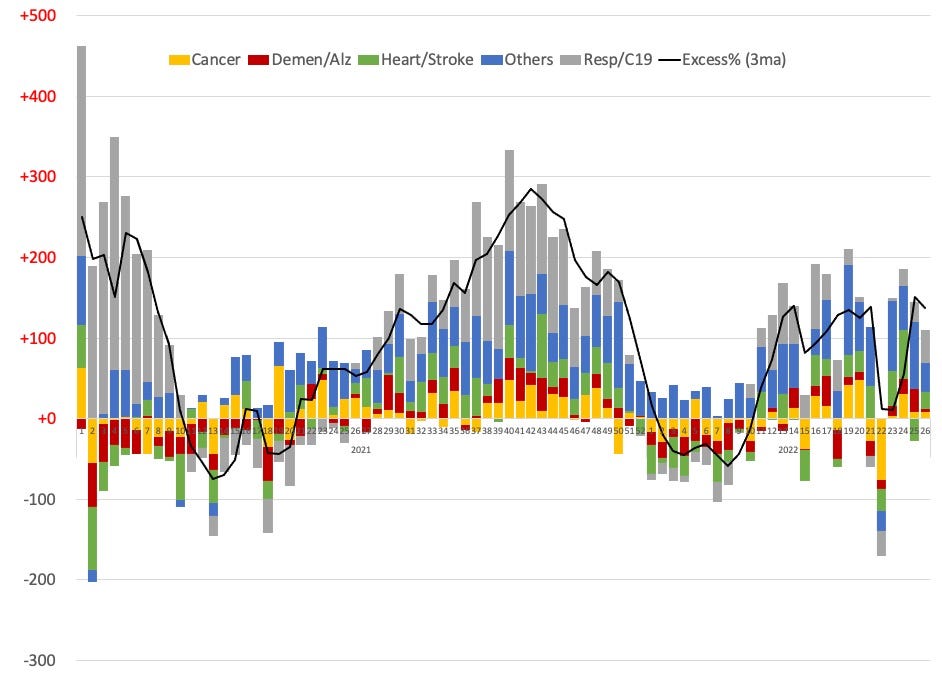
Causes of excess mortality are ‘Others’, Respiratory and Heart attack / Stroke.
Cumulative non-Covid excess mortality by cause
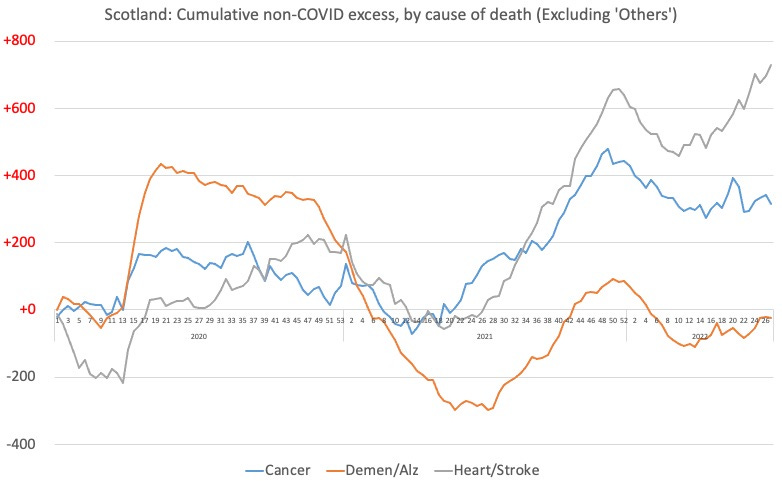
‘Others’ (uncategorised) is by far the main, so have excluded that from this analysis, but we can see Heart Attack / Stroke had been normal until mid 2021, then took off - briefly stabilised and now rising again.
If you wondered whether those trend correlate with certain experimental medications, you’d be correct. Other causes are stable.
Excess mortality by location of death
Death at home was once again the only excess in the most recent week. 98% of all excess death since March 2020 was from people dying at home.
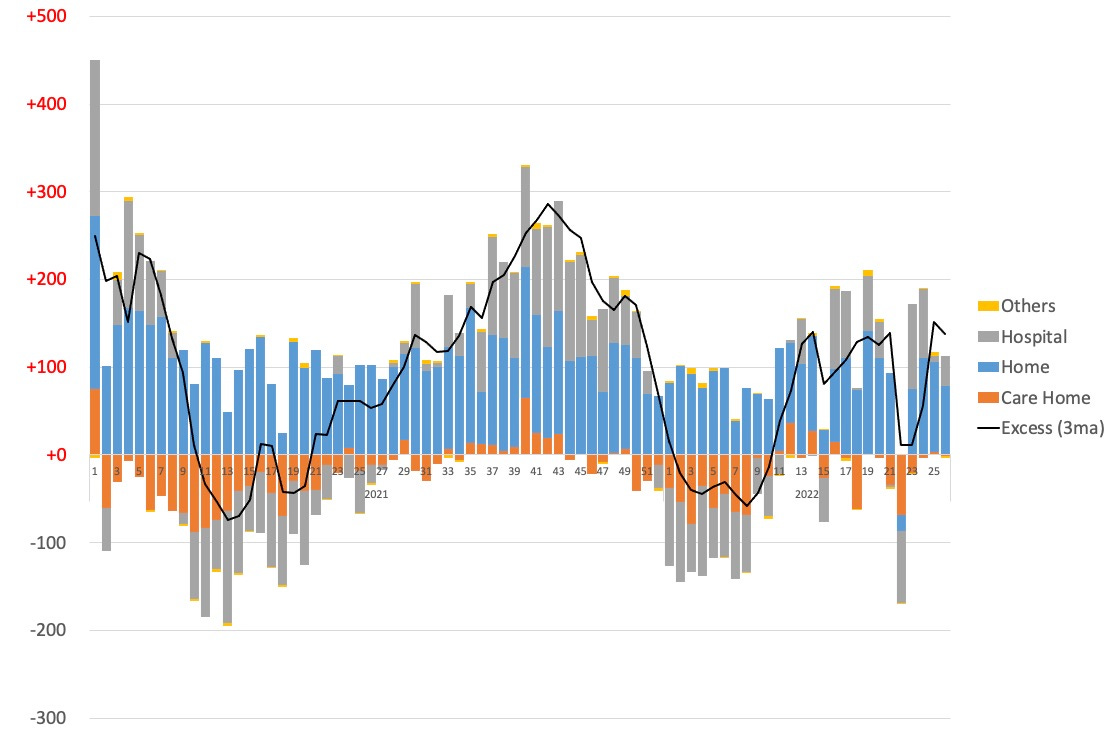
As has been the case since the start of COVID, excess death at home remains the main. Some excess at hospital this week, as we have seen recently.
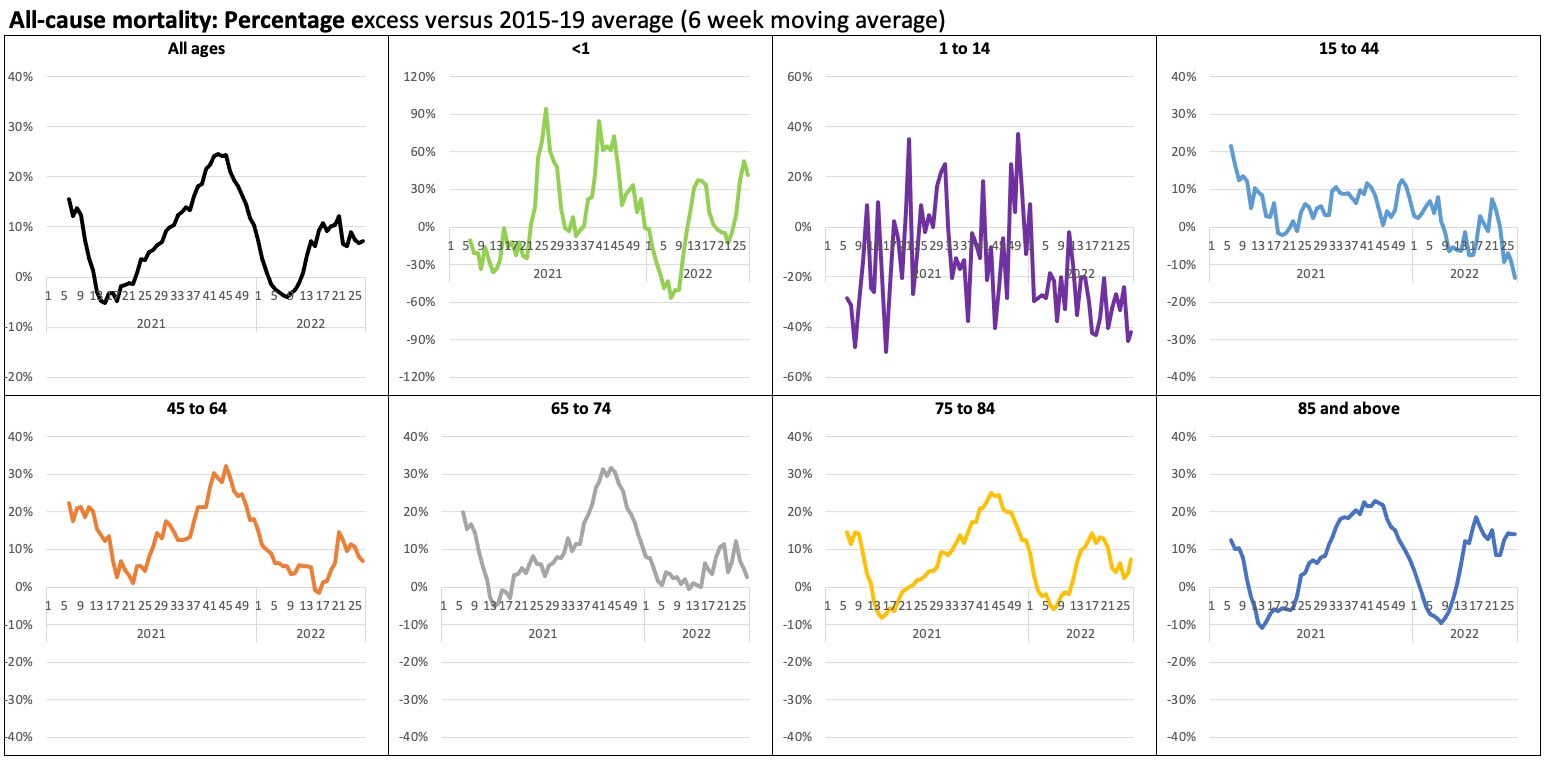
% excess mortality by age
All age groups 45 and over showing ongoing excess, but the higher the age, the higher the excess.
The excess in 85 and over has slightly slowed in recent weeks, but still high.
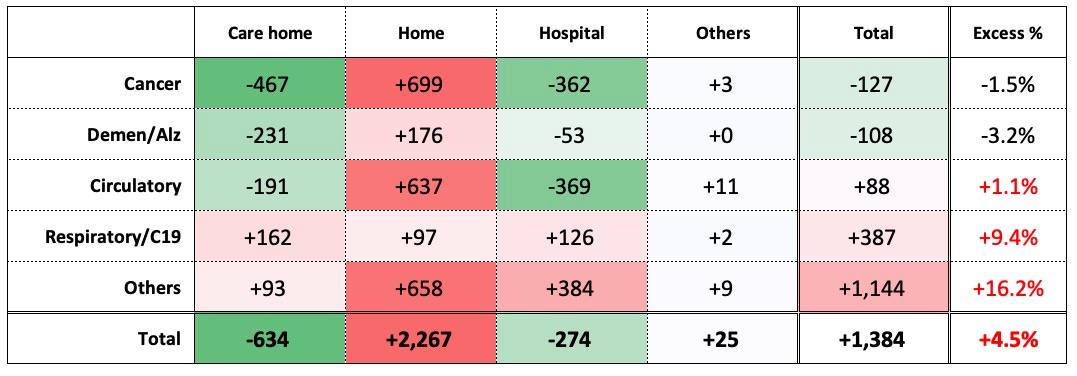
2022 overall excess by cause and location
Excess mortality now 4.5% above normal for the year - hospitals and care homes notably negative, but excess deaths at home hugely above.
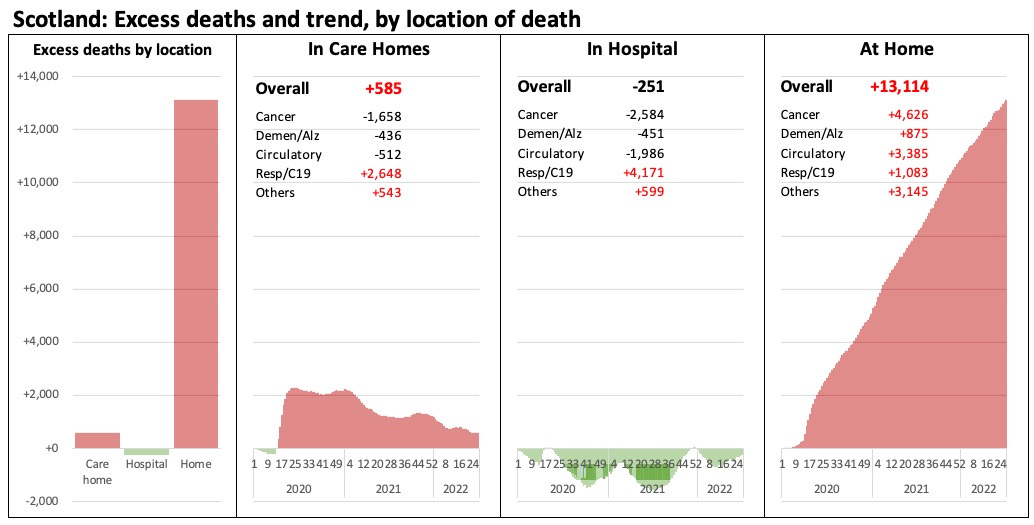
“Save the NHS….die at home”
Cumulative excess mortality in Scotland since the start. 98% of excess deaths - were people dying at home.
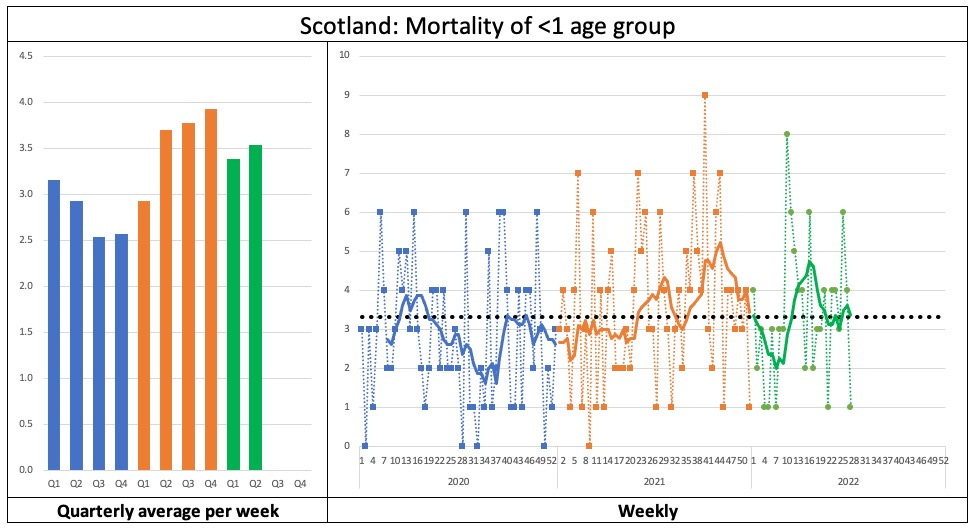
Infant mortality (<1 years)
A low week following last week’s high. Generally this trend has returned to normal after the THIRD spike in mortality seen in Scotland. (Did anything else happen in three stages during pregnancy…?)
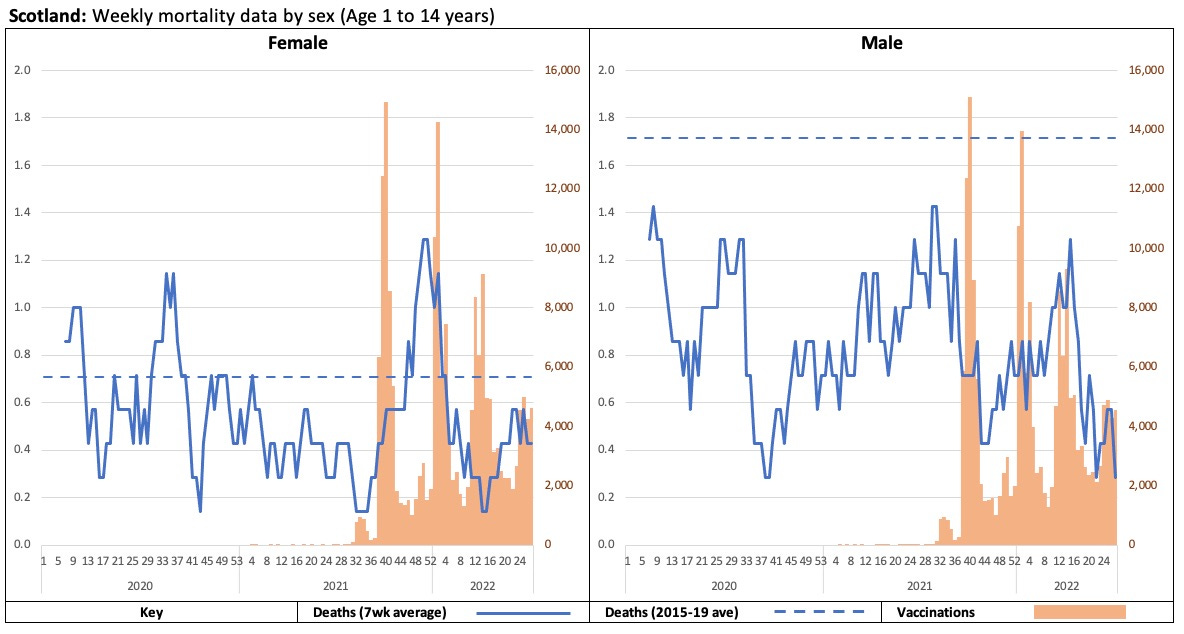
Child mortality (1 to 14 years)
Here we changed the data style, to split out into Female and Male. These mortality numbers are happily very small, but there is a very different rate between girls and boys, and this separation may show numbers as well as trends more clearly.
Not really much to conclude - small numbers are noisy, and even a 7 week average is very up and down, but quite normal.
Excess mortality by age correlated with vaccination

We will keep publishing these analyses week by week.
Best wishes!
Scottish Unity, Edinburgh Group
I only came across this archive today. Many thanks for the work you're doing. It's essential that we in Scotland have clear and accessible challenges to the 'narrative' in this information war.
BTW in the first graph I'd expect the right hand end of the blue line (22) to more or less match the left hand end of the green line (32). Is this a result of registrations being delayed over Christmas?