


Scotland: All cause mortality rates by age group
National Records of Scotland data of ASMR by age group

Two posts in a day…
Perhaps this could have been added to the prior post, but it’s a truckload of graphs showing mortality rates by five-year age band, which is interesting for data-geeks (or for those people in each age band), but too much for a general summary.
So right to it - will post all of these with comments where appropriate
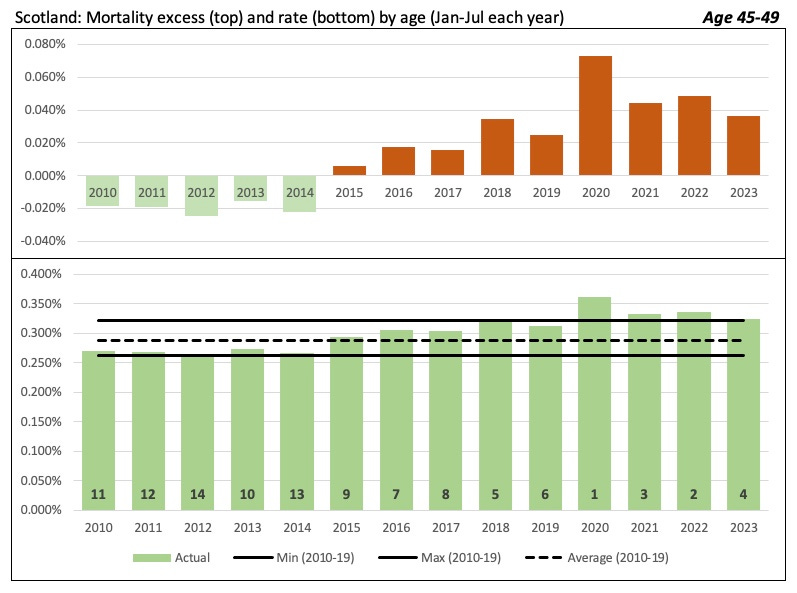
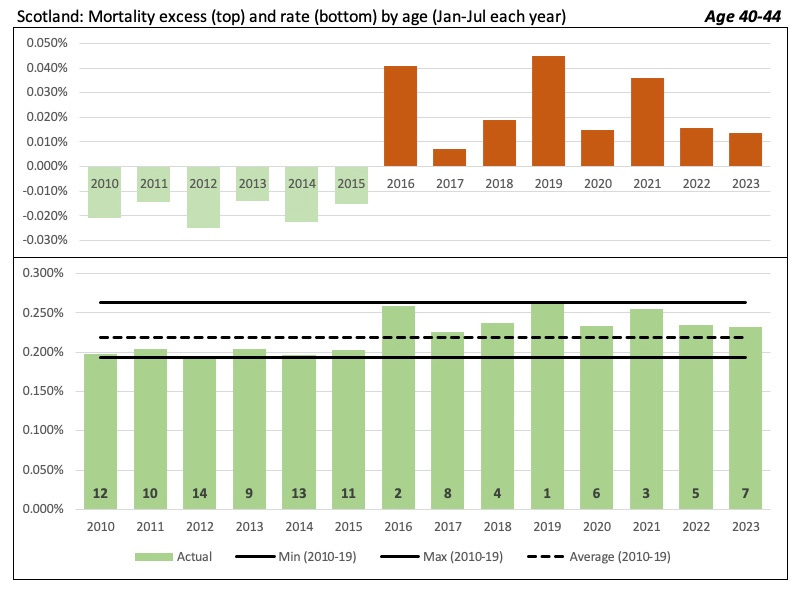
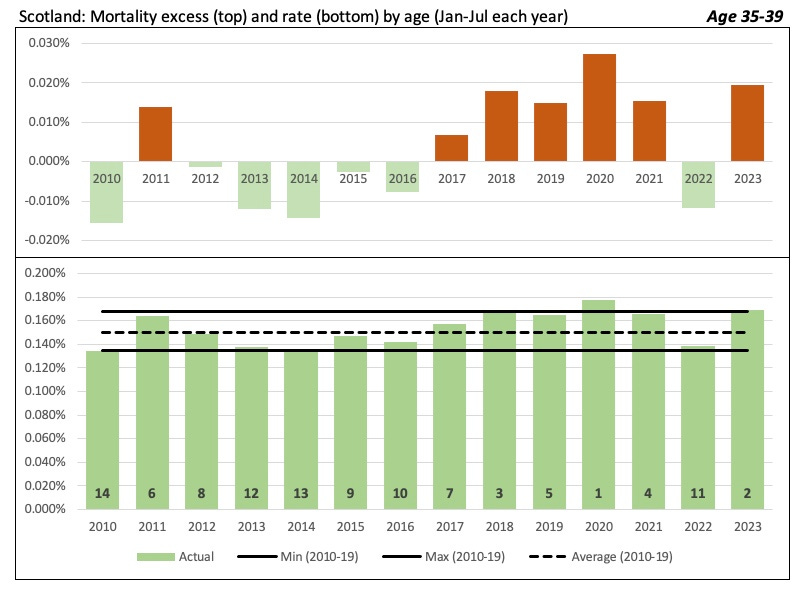
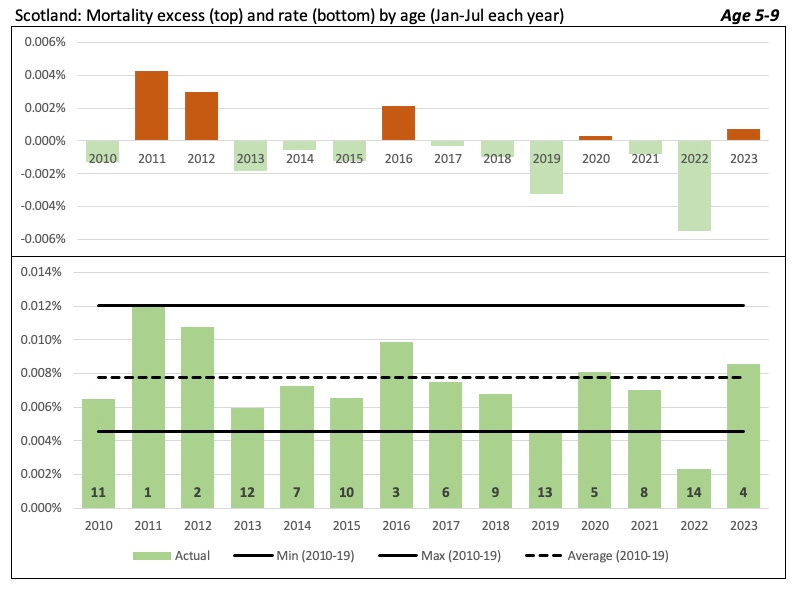
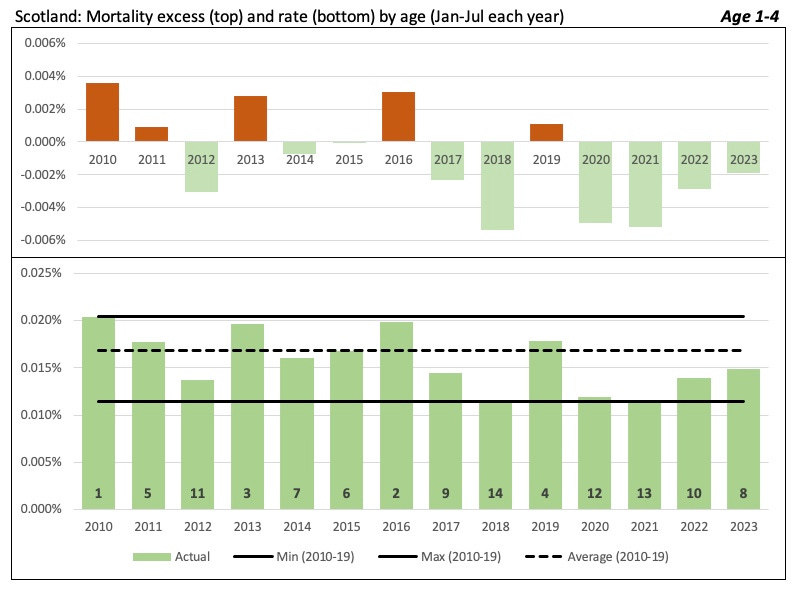
Each chart compares Jan-Jul each year. The upper shows excess versus the 2010-2019 average rate, and the bottom shows the actual mortality rate, with min / max / average bands. At the bottom is shown the rank of each year, with 1 being the worst.
Older age groups
These are the ones “at risk from COVID”, so let’s see how they fared.
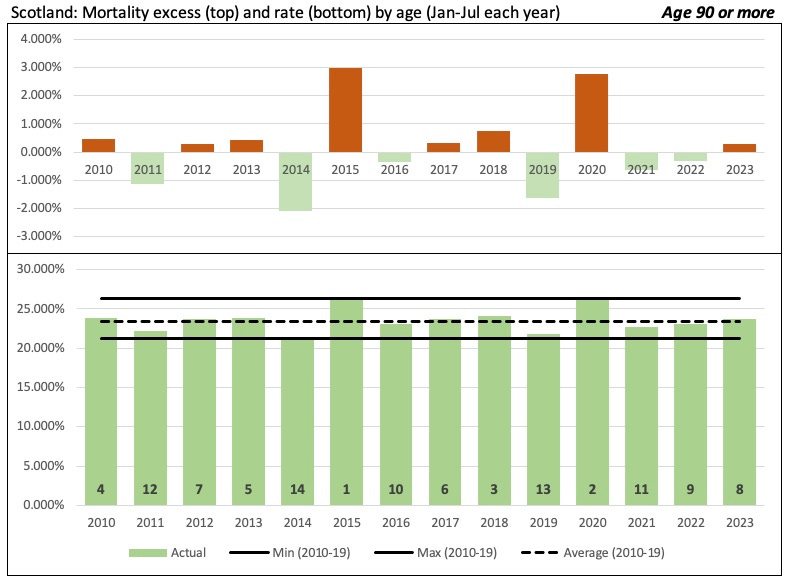
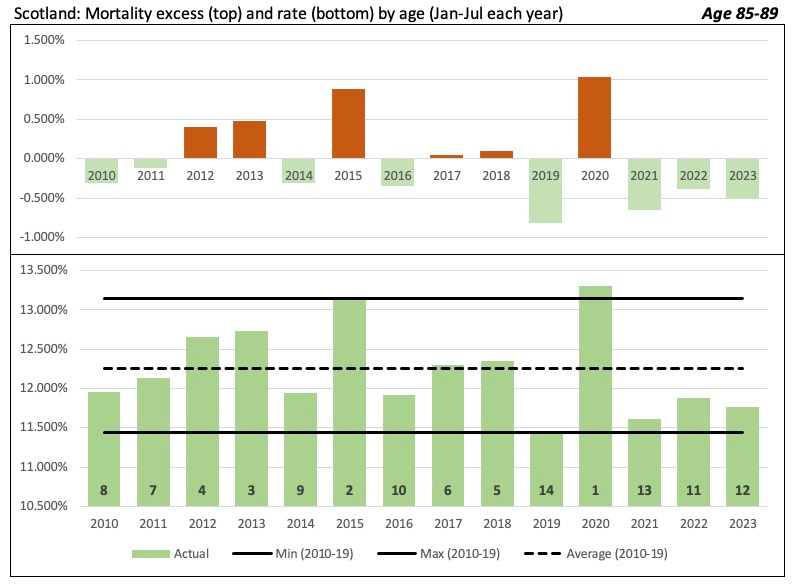
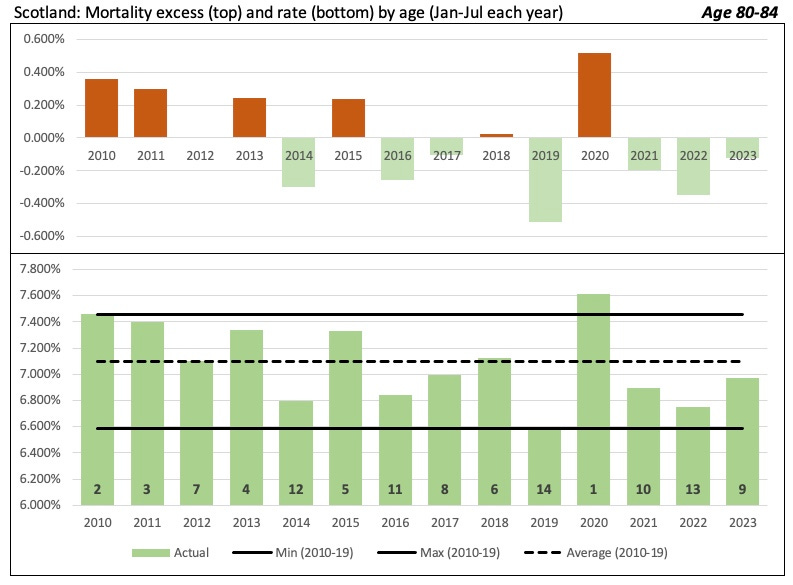
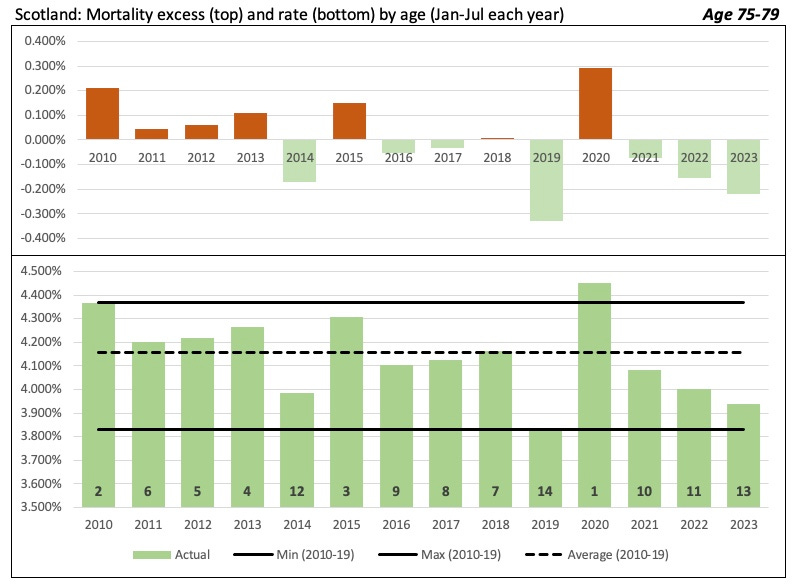
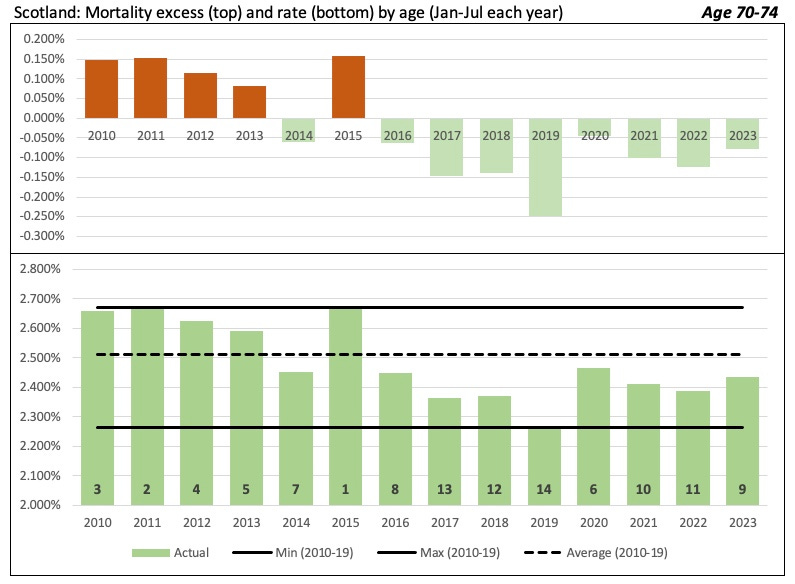
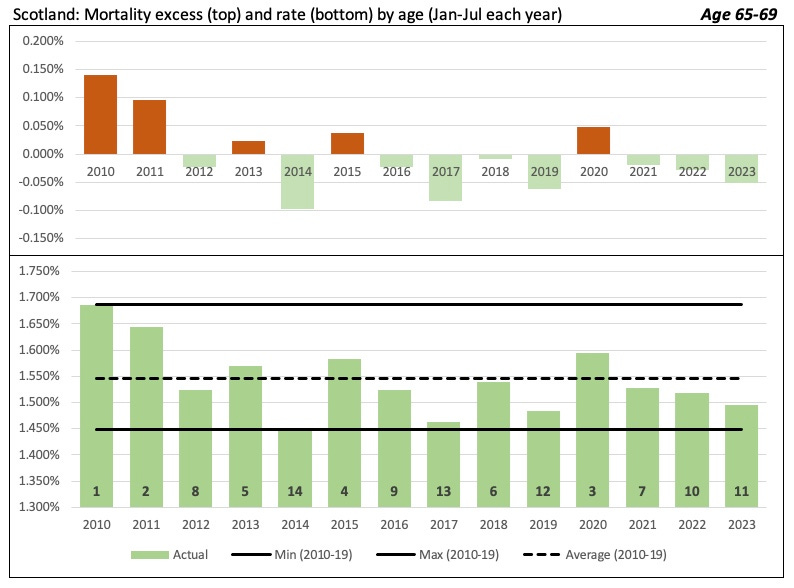
Note that all of these showed a spike up in 2020 - but either similar to the level seen in 2015, or well below. Nothing exceptionally out of the ordinary - then rapidly returned to normal. For age 75 & above we see that 2020 was the worst ranked year (comparing Jan-Jul each year), but similar to 2015 (when the sky didn’t fall, nor the media cry wolf).
Across all ages, none of the other years even make the top 5, typically about the 10th worst year out of these 14.
Middle ages
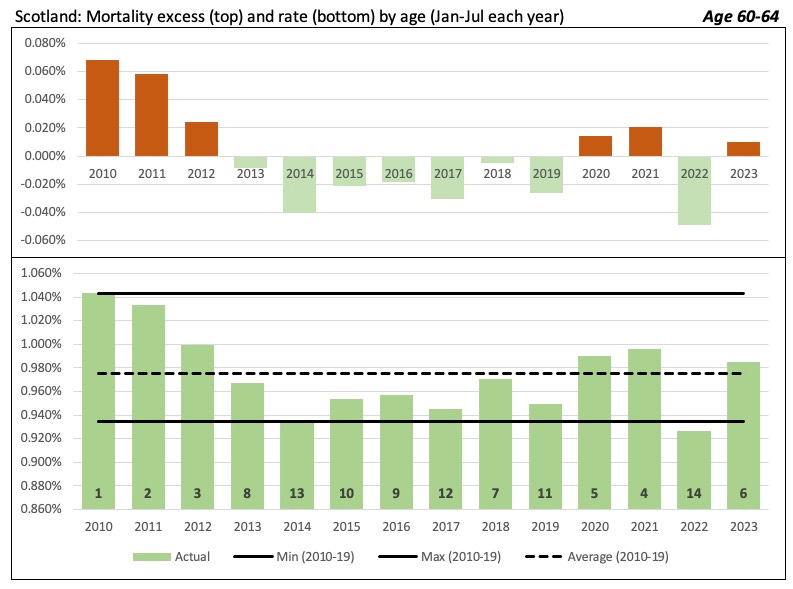
These are where it gets intriguing. These age groups are far less at risk from COVID, there are not so many deaths in these age groups, yet not as healthy as the young. Far more sensitive to loss of needed healthcare.
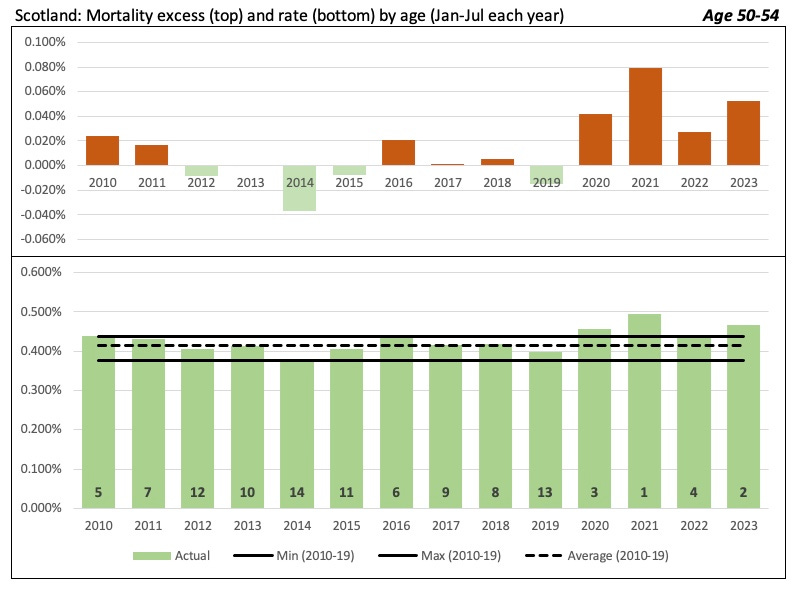
For the above two, 2020 was up, but 2021 (with vaccines, but without normal healthcare) was far worse.
Here there was already an upward trend of worsening mortality, but was worse since 2020 and still remains notably elevated,
Here we see the effect of ‘COVID’ far less, 2020 not in the Top 5 for mortality rate, but again 2021 notably worse, and still elevated.
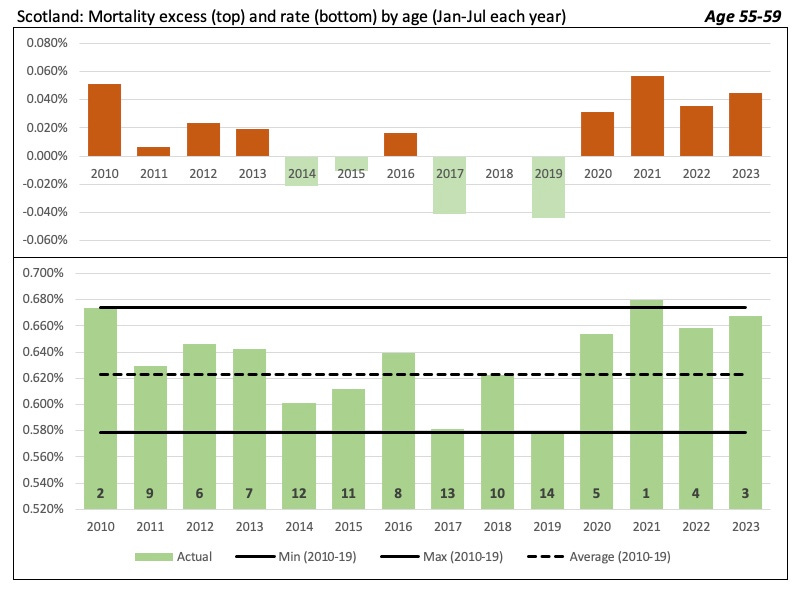
Younger age groups
These ages are by far not affected by COVID, but much more by the consequences of lockdowns, economic losses, suicide and such like.
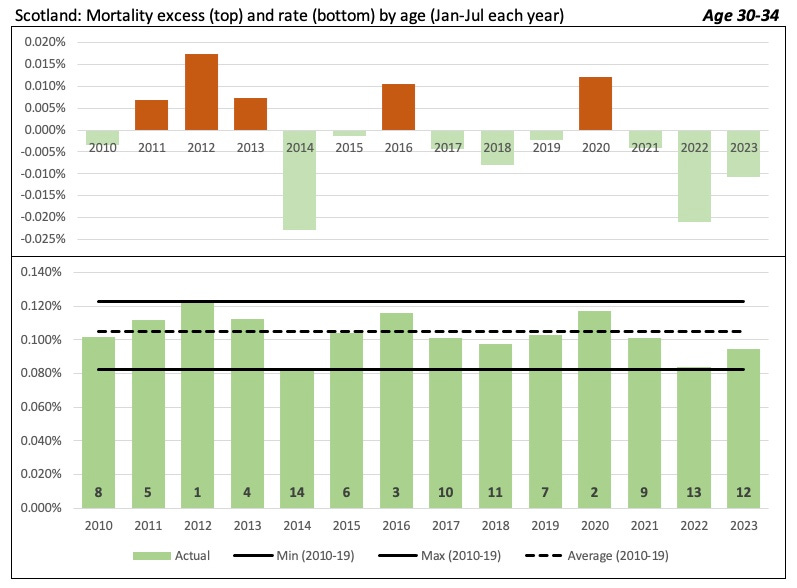
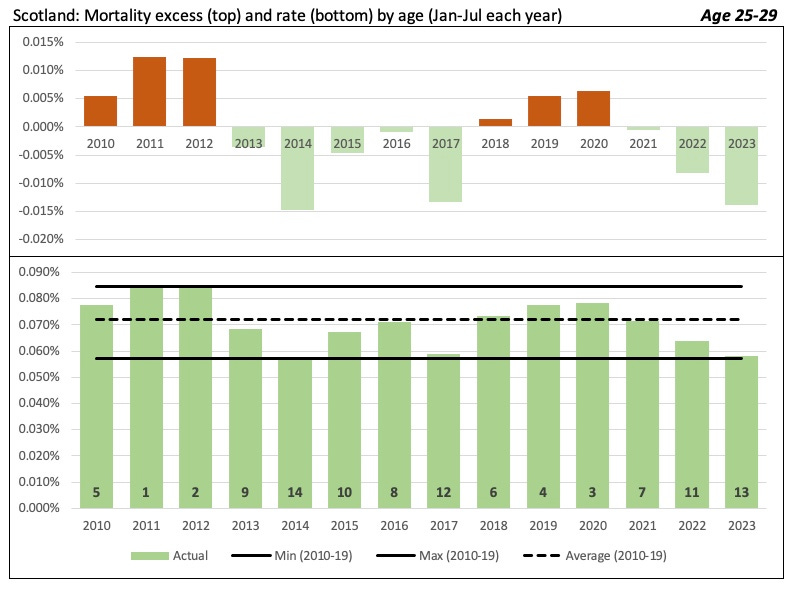
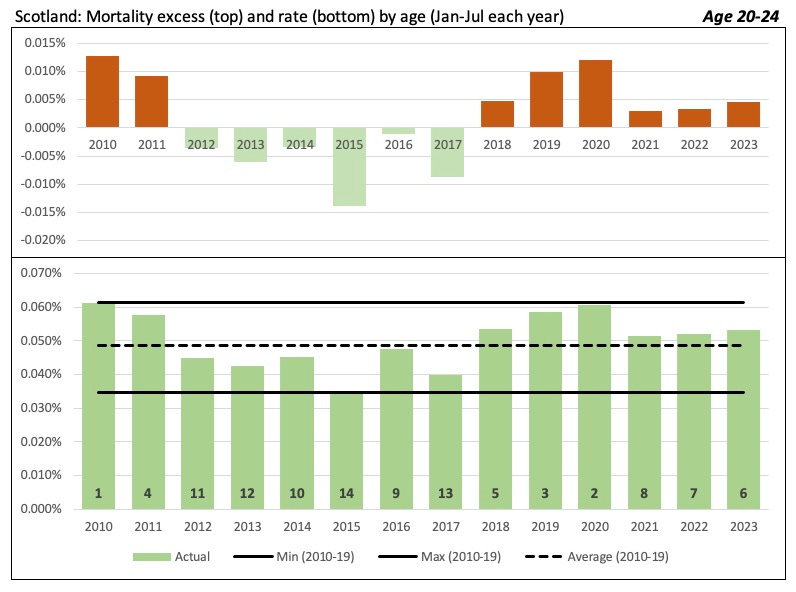
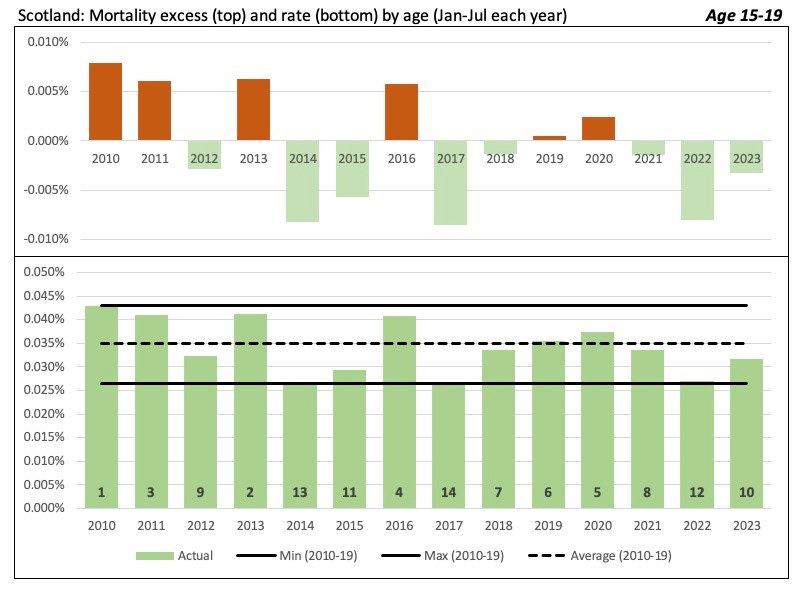
In every case we can see a lot of volatility (these are happily very small numbers, so very prone to up/down movement), but these never leave the normal range throughout
Children
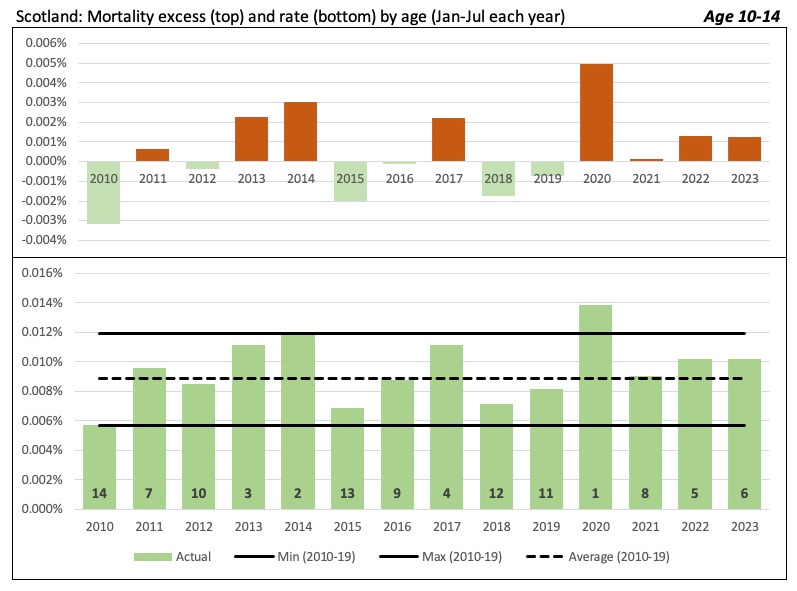
We see a high for 10-14 year olds in 2020, but inclined to think this is normal volatilty, as we don’t see peaks in any other age group, indeed they are lower than usual.
Infants
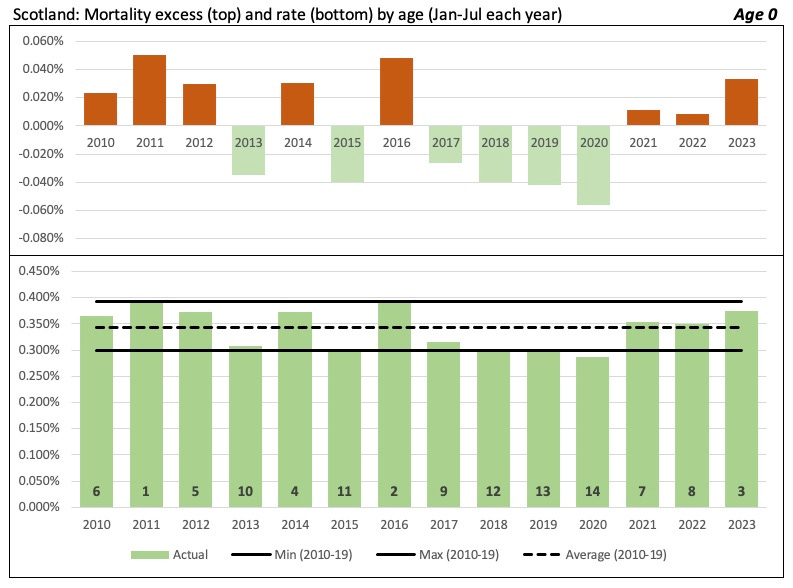
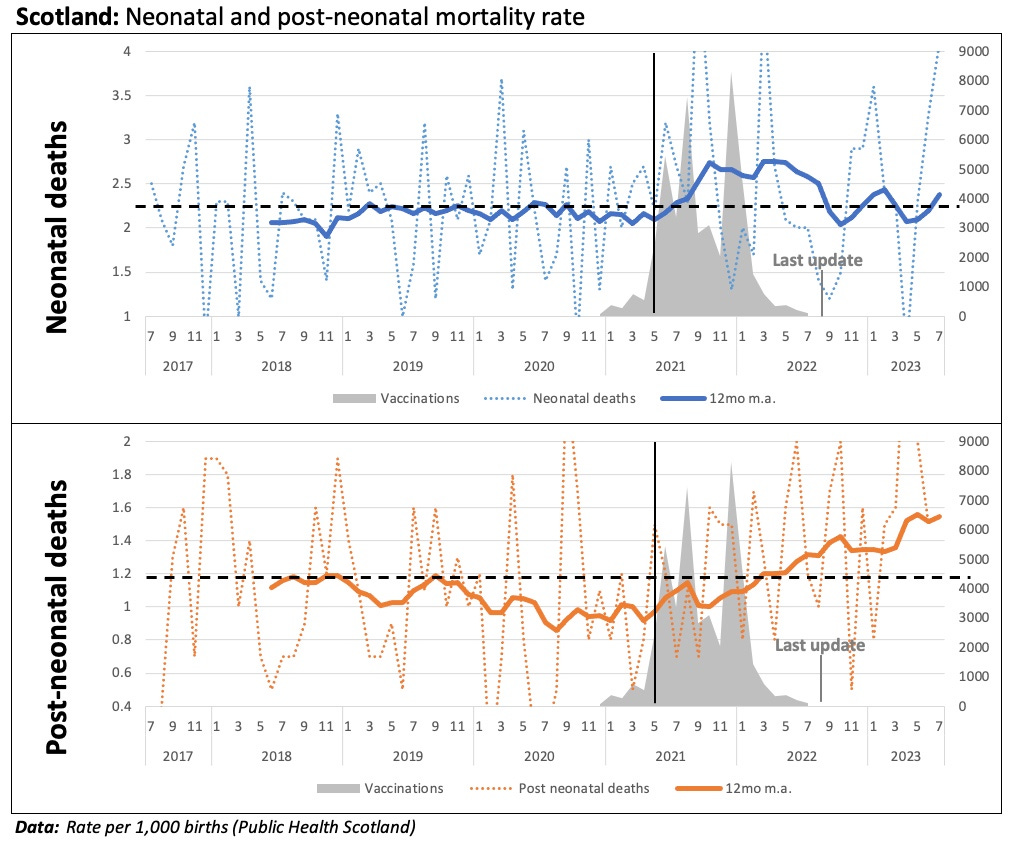
Here we do see a rise - after several years of improving infant mortality we see a rise up. This is somewhat notable on the annualised data, but as we’ve written about before it is far more apparent on the monthly data below. There we can see both neonatal deaths (within 4 weeks from birth) and post-neonatal deaths (beyond 4 weeks) show an immediate rise following the rollout of COVID-19 vaccinations in pregnancy.
Scotland’s “investigation” into this didn’t look at the vaccines, as ‘the powers that be’ didn’t want people to be fearful of the vaccines (the same vaccines that the data suggest may be a factor in the death of new-borns…)
We post this for reference, and people can see how their age group was affected. Overall nothing much was happening in Scotland - the excess deaths we do see come in four waves
April 2020 driven by Lockdown 1
December 2020 driven by Lockdown 2 and initial vaccine rollout
Never-before-seen huge excess in Autumn 2021, rising age-group by age-group in the same order as vaccine rollout
2022 through to early 2023, most likely onging restriction of healthcare.
Thankfully now settling down, and hope to see mortality return more to normality.
Best wishes
Scottish Unity Edinburgh Group